
Melissa Esquibel shares her top tips to save you time and boost your productivity in your Google workspace
Gmail
1. Snooze
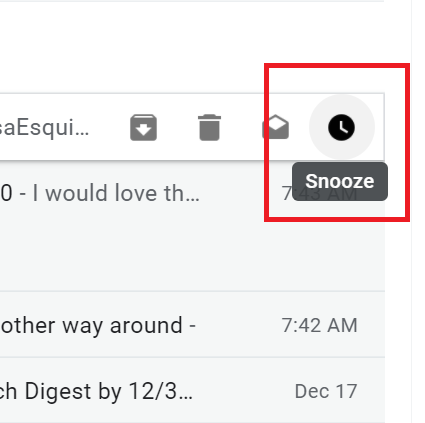
It is more likely than not that if you’re an administrative professional you start your day with an overstuffed inbox. Mixed among the highest priority items (urgent AND important) are the ones that might be considered important but not urgent, or urgent and not important. That last category would be those things that you must take care of, but not before putting out the day’s fires. When you run across either of those last two types of messages, snooze it! As you hover over a message in the inbox, you will see some icons pop up on the right. The one that looks like a clock is snooze.
You can choose:
- Later today
- Tomorrow
- This weekend
- Next week, or
- Pick date & time
2. Send Later
On the other side of the email equation is email you send. One of the worst times to send a message that you really require a “first thing on Monday” response to is end of day, Friday. It might be better for your recipient to see the message after they’ve gone through their inbox haystack on Monday. So, perhaps 9:30 AM or 10:00 AM. Instead of just hitting the Send button at the bottom of the compose window, click the drop-down arrow on the button and choose Schedule send.

From the menu that pops up, you can choose:
- Tomorrow morning 8:00 AM
- Tomorrow afternoon 1:00 PM
- Monday morning 8:00 AM, or
- Pick date and time
Docs
3. Sections
For a long time, Google Docs users who used to be Microsoft Word users bemoaned the fact that they could not section their documents to get different headers and footers within a single document. This ceased to be the case recently. Let’s suppose you want to separate a section called Exhibit A from the main portion of the document and have the first page number of the exhibit read A-1. Before or after you’ve added page numbers to the rest of the document, follow these steps.
From the first line of the exhibit, preferably on a heading that has its title, click on the Insert drop-down menu, Break, then Section break (next page). You will notice that it jumps to the next page.
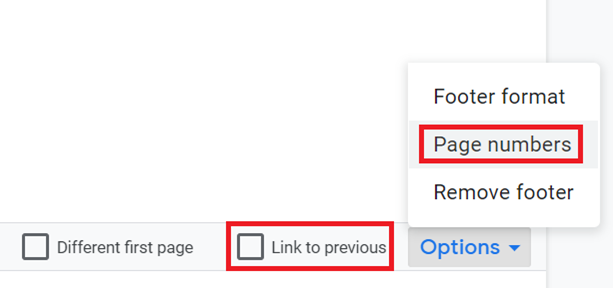
Now, double-click at the bottom of the new exhibit page. Uncheck the box that says Link to previous.
Type “A-“.
Click on the Options drop-down menu and choose Page numbers.
On this dialog box, under Numbering, click the Start at option and make sure the box says 1. Pages you add after this in the point in the document will be A-2, A-3, and so on.
4. Suggesting Mode
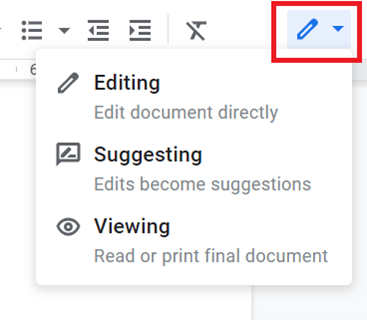
There are three ways to interact with a document in Docs. When you edit a document in Editing mode, changes are made in real time. The only way to get back to what it was to begin with is to access the Version History in the File drop down menu. If you work in Suggesting mode, the changes appear as if they’re actually made, but you will see a comment box pop up on the right side of the document. It will show the change and offer a place to comment or discuss it. In this way people will know why the change was made, what it was and will have an opportunity to challenge it, accept it (check) or reject it (X) on the comment box.
TIP:
Great collaborators explain their edits. With the exception of obvious typos or punctuation errors, explain why a change was made in a way such that future collaborators will understand your point of view or writing style. When a team does this, eventually fewer edits will be needed.
Sheets
5. Explore
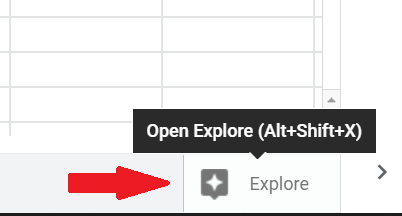
I like to say that data is just data until it tells you something. If you need a little help figuring out what you need to do to get to the “something,” click on the Explore button in the lower right of the screen in Sheets. Sheets offers you several ways to examine and analyze your data.
- Basic Calculations – Results of SUM, AVERAGE, MIN, MAX, COUNTA
- Answers – A field where you can ask a question about your data
- Analysis – Charts and graphs based on your data
It is very important to start with clean and well-organized data for these tools to work optimally. Keep formats within a column consistent (numbers, dollars etc.) and label your columns clearly. This tool learns, so if it gives you a value you don’t like, provide the thumbs up or thumbs down feedback in the panel when it asks.
6. Cleanup Suggestions
Speaking of clean data, did you know that Sheets can help with this task? Let’s take one of the most common problems, text vs. values (numbers). If your formulas or analysis are not delivering consistent results, it may be because you have mixed data types in a column. Click in the middle of contiguous data (no blank rows or columns) or select an entire dataset. Then from the Data drop-down menu, click Cleanup suggestions.
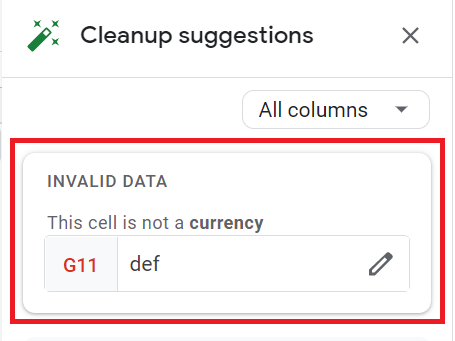
It does not find every inconsistency but it will, for example, detect text data in a column that is supposed to have numbers. On the right will appear the inconsistencies that it finds and an opportunity to edit that particular cell or dismiss the finding, if the individual inconsistencies are indicative of another problem (a row of data copied from one sheet to another but pasted in the wrong starting cell). Like the Explore tool above, it is a new feature that is learning. I imagine over time it will become more robust.
Slides
7. Diagrams
Under the insert tab, you will find the Diagrams selection. If you have been creating diagrams one shape and one arrow at a time, I promise you this will save you loads of time. Once you click Diagrams, you may select from several categories which appear on the right.
- Grid
- Hierarchy
- Timeline
- Process
- Relationship
- Cycle
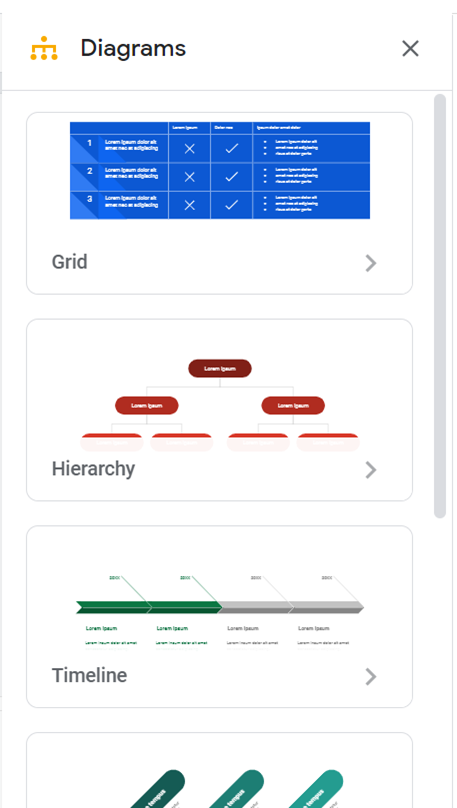
For example, if you choose Hierarchy, you will find examples that will help you create an organizational chart. After choosing Hierarchy, you will be presented with several styles of this type of diagram. At the top of the panel, choose the number of levels you will need and a color to see a refined set of selections. Now, just complete the text labels on your slide. If you have to augment your chart, for example to add another at the second level, select by clicking and dragging around the shapes you need to duplicate. Copy and paste them, then drag to the desired position. Deselect the shapes and select the line that connects it to the level above and “reconnect” it to the appropriate place.
8. Find linked objects
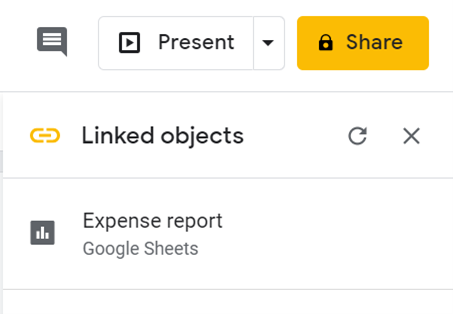
If you have ever inherited a presentation with chart elements that are linked to other files, you know what a “treasure hunt” it can be to validate all the data. You may even be re-doing the whole embedding process to get the most updated data. In Slides, you can click on the Tools drop-down menu and select Linked objects. This will find any embedded charts, tables, slides or drawings that are linked to other files. You’ll get the opportunity to refresh these links to display the latest data.
TIP:
This feature is also in Sheets!
Meet
9. Captions button
In Meet, while in a live presentation, you can turn on captioning. In the lower right corner of the presentation window, you will see a button labeled Turn on captions. You may even be able to select another language depending on the location of license, but only on a computer. On mobile devices as of this printing, you may only choose English. I suspect this feature will be up leveling to include other language choices over time to keep up with the captioning capabilities in the Microsoft suite.

10. Pin a participant
While this might sound a bit aggressive, it is a great way to put focus on a participant throughout the meeting. Whether they are the presenter or the most influential decision-maker in the room, your eyes will not be darting all over the screen looking for who is talking or the expression on a key person’s face as interesting news is being delivered.
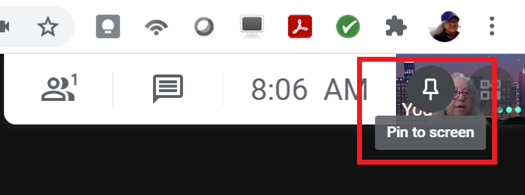
Hover over the person’s name and select Pin to Screen
- Diagrams
- Find linked objects
- Captions button
- Pin a participant







really love these tips Melissa. As a bit of a newbie to Google, im still learning how to do all of the handy hacks that I knew how to do on Word, Excel and Powerpoint. These tips are a real time saver.