Executives want information that’s meaningful, clear, and concise, which is why diagrams of all kinds are a staple of the business world. Charts, graphs, plans, and other types of diagrams can convey information succinctly, but not all diagrams are created equal. That’s where Microsoft Visio can help.
Visio makes it easy to create, edit and format effective diagrams from organization charts to business process flows to timelines –and much more. All you need are a few simple concepts, one of Visio’s smart templates, and the program’s straightforward tools. Visio offers so much, this article provides a brief introduction and shares some tips for making the most of this powerful diagramming tool.
Shapes, connectors, stencils and templates are the bedrock that makes Visio so easy to use. These terms are all found in the Oxford English Dictionary, but what do they represent in Visio-speak?
• Visio shapes look like clip art, but they’re much more powerful. You can construct diagrams by dragging and dropping shapes onto a drawing. Visio shapes are built from vectors so you can easily resize, edit, and format them. They also come with built-in behaviors so they know how to act in different situations — more than can be said for some people. For example, in an organization chart, a Manager shape knows to connect to the Executive shape on which you drop it; and the organization chart shapes automatically position themselves according to the layout you’ve selected, such as horizontally or in a vertical column below their manager.
• Visio connectors define relationships between shapes, such as the reporting relationship between an executive and a manager on an organization chart or a flow of data on a business process diagram. When shapes are linked with connectors, you can rearrange or align them with a few clicks using Visio’s layout commands. When shapes are linked with connectors, you can move shapes around while Visio takes care of neatly redrawing the connectors, so the drawing doesn’t look like a plate of spaghetti.
• Visio stencils are home to the shapes and connectors you use to build diagrams. Visio comes with hundreds of ready-made stencils that contain the shapes you need for a specific type of diagram, such as the Organization Chart Shapes, Timeline Shapes, and Connectors stencils. You can also add shapes you use frequently to a Quick Shapes stencil so they’re readily available. You can add connectors manually, but you’ll learn shortly that Visio can create connections automatically.
• Visio templates put together a variety of settings and elements, so you can get to the business of building a diagram without pesky setup. When you create a new file using one of Visio’s built-in templates, such as Organization Chart, Visio automatically displays stencils with shapes and connectors for the type of diagram you’re creating; adds a tab (Org Chart in this case) with specialized commands for the diagram type; chooses options, such as drawing scale, page size, and page orientation; and adds a blank drawing page to the file.
Whether you start with a blank page or modify an existing diagram, Visio 2010 offers a variety of time-saving features. The shapes you use most often within a given stencil bubble up to the Quick Shapes area at the top of the stencil so they’re easy to find. And if you drag and drop shapes from several stencils, the Quick Shapes stencil is a collection of all the shapes from each open stencil’s Quick Shapes area, so you can add shapes to your drawing without switching between stencils.
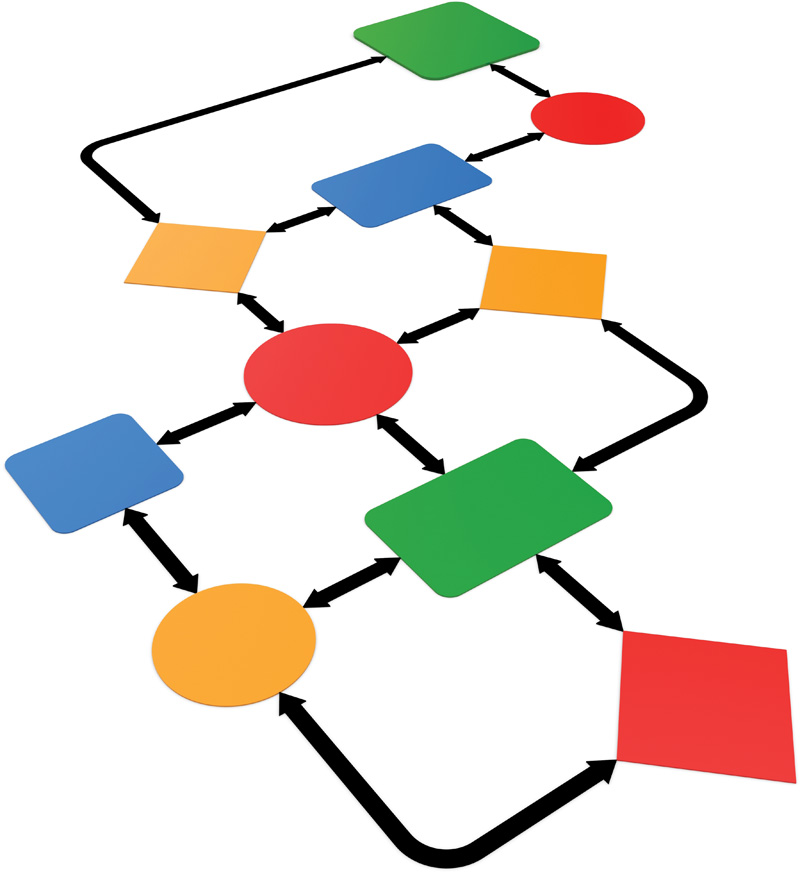
Suppose you’ve dropped a Process shape onto a drawing to begin to document a process flow. When you hover the mouse over that shape, AutoConnect triangles appear at the top, bottom, left, and right of the shape. If you want to connect another shape to this one, point to one of the AutoConnect triangles. A Quick Shapes mini-toolbar appears, which contains the first four shapes from the Quick Shapes area of the active stencil. Click a shape, such as the Decision shape, in the mini-toolbar and Visio adds the shape to the page, connects it to the existing shape, and positions the new shape so it is properly spaced and aligned. If you select a shape in a stencil and then point to an AutoConnect triangle, Visio automatically adds a copy of the selected shape to your drawing.
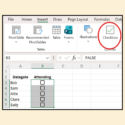
With some diagrams, you can shortcut construction by importing data. Suppose you already have personnel data in a text file, Excel spreadsheet, Microsoft Exchange Server directory, or any ODBC-compliant data source. Visio’s Organization Chart Wizard template asks for the source of the data and then builds the organization chart. (The wizard needs columns with the headings Name and Reports-To to create the reporting structure. If the file contains other data, you choose the fields that you want to display in the chart.)
Of course, personnel data isn’t static. People come and go, receive promotions, change their names, and so on. You can make your Visio diagrams as dynamic as the roster for your company. The Data Selector wizard (Link Data to Shapes on the Data tab) helps you define links so Visio can pull data from sources, such as Excel, Access, SQL Server, SharePoint Services, or other databases. Because the data is linked to your diagram, Visio’s Automatic Refresh will keep your diagram up to date without any effort on your part. If you create a diagram to illustrate status or progress, Data Graphics (Data Graphics on the Data tab) can display values graphically, using bars, colors, icons, or text. For example, you could represent progress on a task with a bar that shows the percentage of work complete or use traffic light icons to show whether a task is ahead of or behind schedule.
Visio 2010 has formatting tools that make diagrams look as though they were prepared by a top designer with a great eye for color. Visio themes are sets of colors designed to look good together. When you hover the pointer over a theme (on the Design tab), Live Preview temporarily applies the theme colors to the diagram, so you can see what the diagram will look like before you commit to the theme. In addition, if you add a background to your drawing, Visio suggests additional themes with complimentary background colors.
When you right-click a shape, a formatting mini-toolbar appears near the shape. You can change the font, the font size or color, the shape fill color, the shape border formatting, and more. The color palette that appears for fonts, shape fills, and borders include the colors from the theme you’ve chosen with several gradations of each color from light to dark.
Here are some of the Visio templates that you might find helpful:
The General category includes three templates for creating basic block diagrams, whether you want very basic shapes (Basic Diagram), blocks and connectors that are a bit smarter (Block Diagram), or three-dimensional shapes (Block Diagram With Perspective).
The Business category includes the Organization Chart template and the Organization Chart Wizard template, mentioned earlier. In addition, the Business category offers a Charts and Graphs template and a Marketing Charts and Diagrams template. The Charting Shapes stencil that opens with the Charts and Graphs template includes shapes for standard graphs, tables for comparing product features, shapes to create pie charts, and so on.
The Flowchart category includes templates for illustrating processes of different types. The Basic Flowchart template includes a handful of shapes for documenting procedures. The Work Flow Diagram template contains several stencils with icons that represent different departments within an organization. You can build a workflow by connecting departments and work flow objects with connectors. The Cross-Functional Flowchart template offers shapes for showing procedural steps in separate swimlanes for each functional area that performs work.
With templates in the Maps and Floor Plans category, you can lay out your own office or several offices within an area. These templates use several stencils to provide shapes for walls, doors, furniture, equipment, and accessories.
Finally, in the Schedule category, the Timeline template is helpful when you want to show when events occur, such as the tasks and milestones leading up to a major trade show. You begin by adding an overall timeline to a drawing. Then, you can drop blocks to indicate tasks or intervals to show phases. The Timeline Shapes stencil include several shapes for milestones. In addition, you can expand part of a timeline to show additional detail by adding shapes that synchronize with the main timeline.
The diagrams you create with Visio can be incorporated into other files or shared in several ways. You can paste or link a Visio diagram within a Word document, Excel spreadsheet, PowerPoint presentation, or other program file. You can also save Visio diagrams as static Web pages or in PDF or XPS format. If your company uses SharePoint, you can also share a data-linked diagram that updates dynamically as the underlying data changes, for example, to include an up-to-date organization chart with contact information that everyone can access.
“