
Traci Williams explains how to use Excel as the tool of choice for creating an effective stock management system
As an Executive Assistant, a myriad of different types of tasks will fall under your remit, and you must be able to utilise some great tools (and skills) to achieve efficiency and effectiveness in all of them.
One such task would be overseeing stock levels, ordering supplies, or even managing stock items for specific projects.
And of course, I would recommend Excel as the tool of choice to help you approach this task. It’s super versatile and very user-friendly, so should be your go-to solution for creating an effective stock management system.
This article will guide you through how to create a simple process in Excel, and some of the functions and formulas that you might need.
Overview
I’d recommend using a process similar to this:
- Create a ‘Stock Summary’ sheet with a row for each Stock item. This will include key information for each stock item, such as: Item No, Item Name, Price, etc. This will be manually populated with the details for each item, but the ‘Qty in Stock’ can be calculated using a formula.
- Create a ‘Stock Movement’ sheet where you can include every occurrence of Stock In & Out. This can then be traced back to individual Orders, whilst also being used in the ‘Stock Summary’ above to calculate the total ‘Qty in Stock.’
- Include ‘Conditional Formatting’ in the ‘Stock Summary’ sheet to highlight when stock levels fall below the Reorder level, signifying that an order needs to be placed.
- Create Reports linked to the ‘Stock Summary’ & ‘Stock Movement’ sheets that analyse the data to help you to make informed decisions.
Here’s a step-by-step guide to each of these points:
1. Create a ‘Stock Summary’ Sheet
On a new blank spreadsheet, set up a column for each item of information that you need to manage. Here is a suggested list (of course, yours may look different to this):
- Item No: A unique identifier for each item (it is vital to make sure none of these are duplicated)
- Item Name: A brief description of the item
- Category: The type or category of the item (e.g., Office Supplies, Electronics, etc.)
- Supplier: The name of the supplier for each item
- Purchase Price: The cost at which the item was purchased
- Selling Price: The price at which the item will be sold (if applicable)
- Qty Opening Stock: The current number of units available at the start of the process
- Qty in Stock: The current number of units available (calculated by linking to the ‘Stock Movement’ sheet PLUS ‘Qty Opening Stock’)
- Reorder Level: The minimum quantity of an item before you need to reorder
- Reorder Qty: The number of units to order when restocking
- Total Value: The total value of the current stock (calculated by multiplying the purchase price by the quantity in stock)
This would appear similar to this:
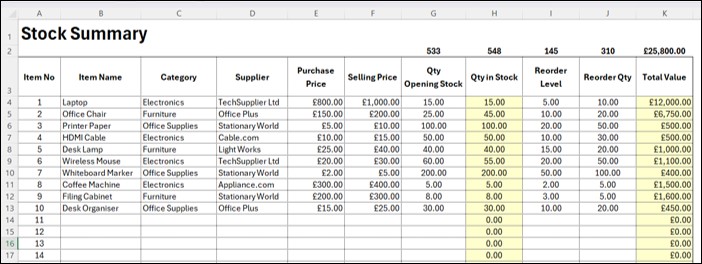
Note: Column A has been pre-populated with unique Item Nos to ensure there are no duplications.
Each row can now be manually populated with data for each stock item, using the white cells.The yellow cells contain formulas and will automatically calculate as data is added. Please see section 5 for more information on the formulas used.
2. Create a ‘Stock Movement’ Sheet
On a new blank spreadsheet (in the same file), set up the columns required to record the stock movements, such as:
- Item No: A unique identifier for each item (this would be linked to a pick list from the ‘Stock Summary’ sheet in order to ensure a relevant Item No. is selected)
- Item Name: A brief description of the item (this would be linked to a formula based on the Item No.)
- Date: The date of the stock movement, entered using the format: dd/mm/yy
- Stock In Qty: The quantity of units being received (being brought in)
- Stock Out Qty: The quantity of units leaving (being used/sold)
- Stock Value: The value of the stock (this would be linked to a formula based on the Qty & Price from the ‘Stock Summary’ sheet)
It could also be useful to include a PO Number or Customer Order Reference here too, so each movement can be traced more directly.
This would appear similar to this:
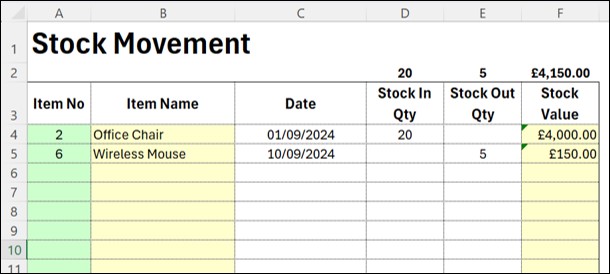
Each row can now be manually populated with data for each Stock Movement, using the green (indicating a pick list) and white cells.The yellow cells contain formulas and will automatically calculate as data is added. Please see section 5 for more info on the formulas used.
2.1. Create pick lists using Data Validation
To ensure data consistency and that a valid Item No is being used in Column A, I would recommend using the Data Validation feature to include a pick list into this column. This will prevent an Item No from being entered if it does not exist on the ‘Stock Summary’ sheet.
To set up data validation:
- Highlight all of the cells where you want to apply the validation.
- Go to the Data tab, select Data Validation, and choose List.
- Navigate to the relevant cells in column A of the ‘Stock Summary’ sheet, then click OK.
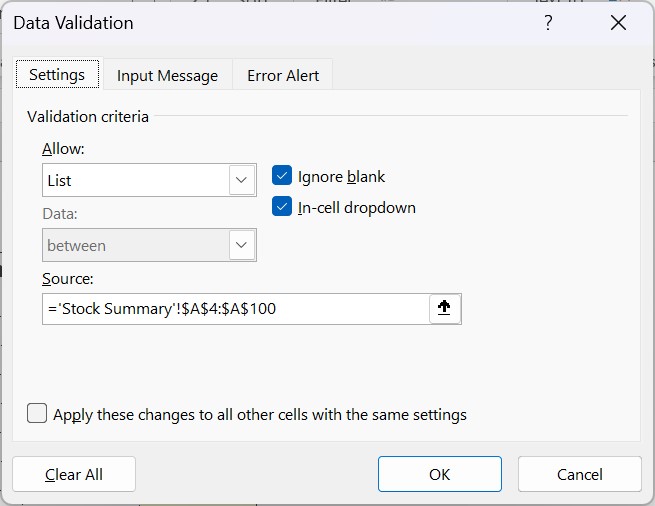
3. Set Up Conditional Formatting in ‘Stock Summary’
The Conditional Formatting function will highlight important information automatically when data changes. For example:
Low stock alerts
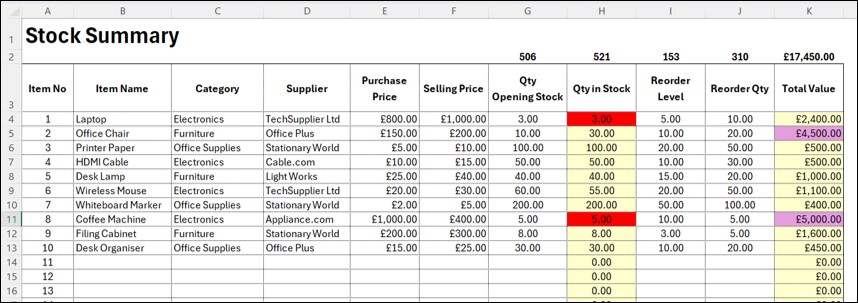
Apply red fill to cells in the ‘Qty in Stock’ column when the stock level falls below the ‘Reorder’ level.
To set up this conditional formatting:
- Select the cells you want to format.
- Go to Home ribbon, then Conditional Formatting, then New Rule.
- Select Rule Type: Use a formula to determine which cells to format, then enter the formula and formatting as follows:
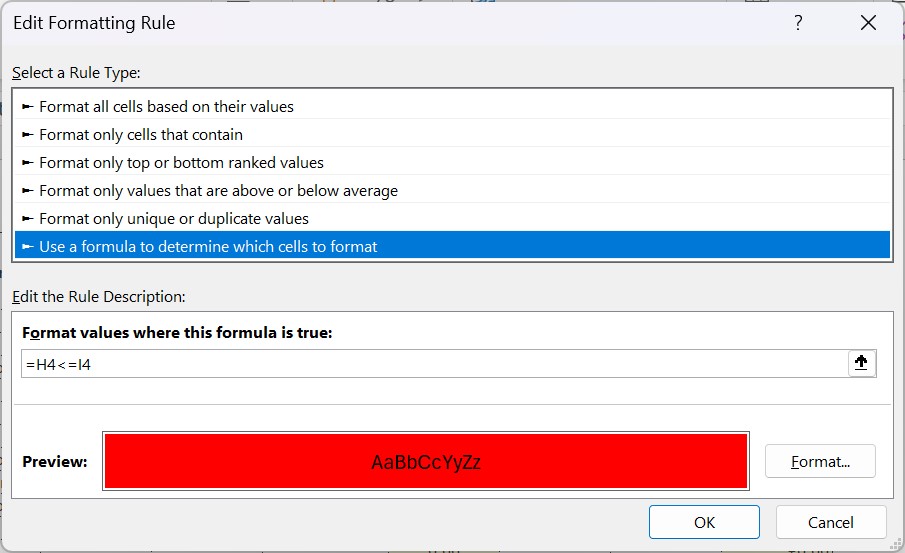
High-value items
Highlight items with a ‘Total Value’ above a certain value (say £4,000) to monitor high-value stock.
To set up this conditional formatting:
- Select the cells you want to format.
- Go to the Home ribbon, then Conditional Formatting, then New Rule.
- Select Rule Type: Use a formula to determine which cells to format, then enter the formula and formatting as follows:
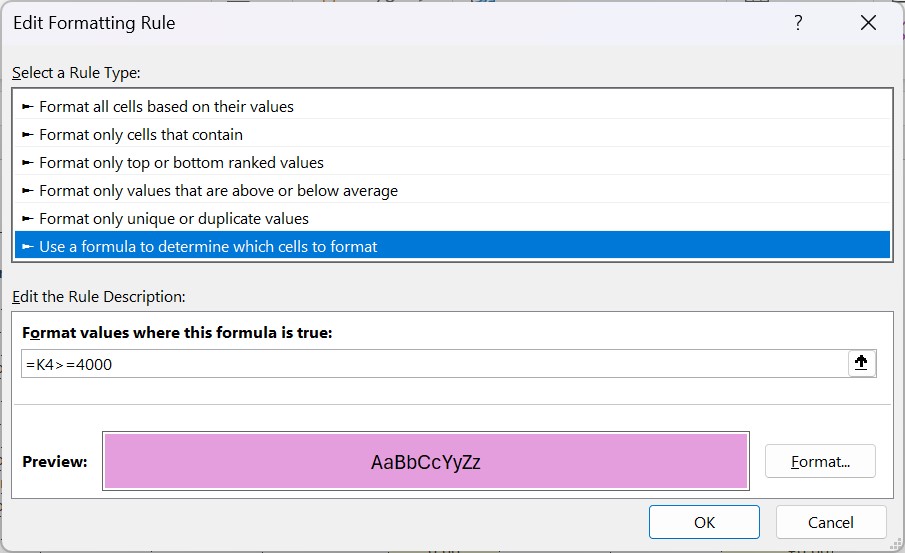
Both of these rules will now appear on the ‘Stock Summary’ sheet as follows to make these stock items stand out. Of course, the colours will change as the data changes too:
4. Reports
The ‘Stock Summary’ sheet now provides a perfect snapshot of your current stock levels and any items that may need to be reordered, but we can also use this data (and that from the ‘Stock Movement’ sheet) to build other reports to analyse stock usage.
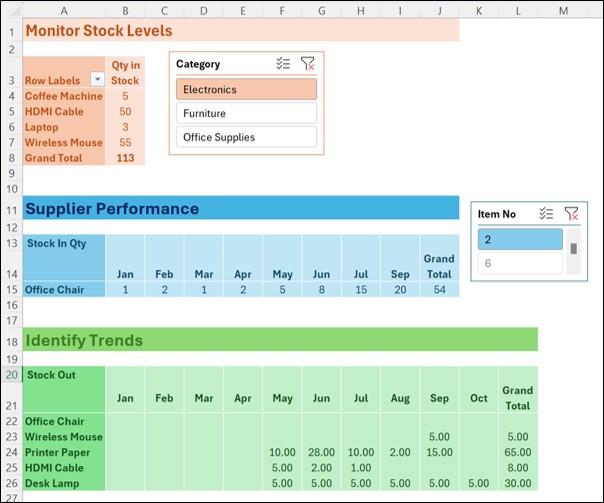
Pivot tables are excellent tools for summarising and analysing datasets quickly and simply. Some examples are:
- Monitor Stock Levels: Quickly view the total quantity of each item in stock for specific categories.
- Supplier Performance: Review the stock ordered from different suppliers. Seeing the order history can be useful if you are trying to negotiate better payment terms.
- Identify Trends: Spot trends in stock usage or sales over time.
To create a pivot table:
- Highlight your data range (or use a Named Range), go to the Insert ribbon, and select PivotTable.
- Drag and drop fields (e.g., Item Name, Qty in Stock, Supplier, etc.) into the rows, columns, and values areas to create your summary.
5. Formulas
These are some of the formulas used:
Stock Summary sheet
- Total Value: =H4*E4

- Qty in Stock:
=SUMIF(‘Stock Movement’!$A$4:$A$100,’Stock Summary’!A4,’Stock Movement’!$D$4:$D$100)
-SUMIF(‘Stock Movement’!$A$4:$A$100,’Stock Summary’!A4,’Stock Movement’!$E$4:$E$100)
+G4 *Opening Stock
Syntax: =SUMIF(range, criteria, [sum-range])

Stock Movement sheet
- Item Name: =IF(A4=””,””,VLOOKUP(A4,Stock_data,2,FALSE))

- Stock Value: =IF($A4=””,””,VLOOKUP($A4,Stock_data,6,FALSE)*SUM(D4:E4))

Conclusion
As an Executive Assistant, being able to use Excel for stock management can make you much more efficient and effective, and it is relatively simple too.
By implementing the techniques outlined in this guide (i.e., using formulas, conditional formatting, data validation, and pivot tables), you can ensure that your stock is well-managed, which ultimately leads to better (and more timely) decision-making.
Of course, the techniques described in this article are not exclusive to stock management, so investing your time in developing your Excel skills will help not only with this specific task, but also the other million(ish) tasks that come your way.


