
Traci Williams, a Microsoft Excel Most Valuable Professional, gives us the rundown on which AI tools work best with Excel
What is AI?
AI – or artificial intelligence – is simply the simulation of human intelligence by machines. In practice, it means using smart tools that can understand natural language, learn from patterns, and generate helpful outputs, without needing specific programming for every task.
AI can be super smart, speedy, and helpful – but it’s no substitute for a human (yet!). It can make mistakes, so always check the responses.
AI Sources Explored in This Article
ChatGPT
A browser-based tool for typing plain-English questions like “How do I write a SUMIFS formula with multiple criteria?”, generating answers, formulas, and explanations.
- Free version available
- ChatGPT Plus (GPT-4): ~£16 ($20) /month
- Not Excel-specific
Analyze Data (on the Home ribbon in Excel)
Built-in tool (since 2018!) that suggests charts and insights instantly from your Excel data.
- Free with Microsoft 365
- Works onWindows, Mac, or web
Copilot
Microsoft 365’s embedded AI assistant for writing formulas, summaries, dashboards, and more directly in Excel.
- Requires a per-user/per-month Copilot licence (in addition to a Microsoft 365 subscription)
- Available in Business Standard, Premium, E3, or E5
- Only works with current builds (Windows/web)
How Can AI Help with Excel?
Whether you’re a data novice or already an ace at Excel, AI tools can help speed up your work, reduce mistakes, and even uncover insights you might have missed.
You can use AI for all of the following functions:
- Writing formulas
- Summarising data
- Cleaning/transforming data
- Explaining errors or functions
- Creating dashboards/templates
- Writing VBA (macros)
- Writing M code (Power Query)
- Troubleshooting tasks
Practical Use: Analyze Data
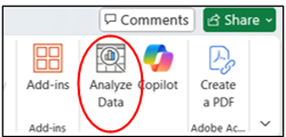
This tool lives in the ‘Home’ ribbon (on the right):
This will open a side panel that appears on the right-hand side of the screen:
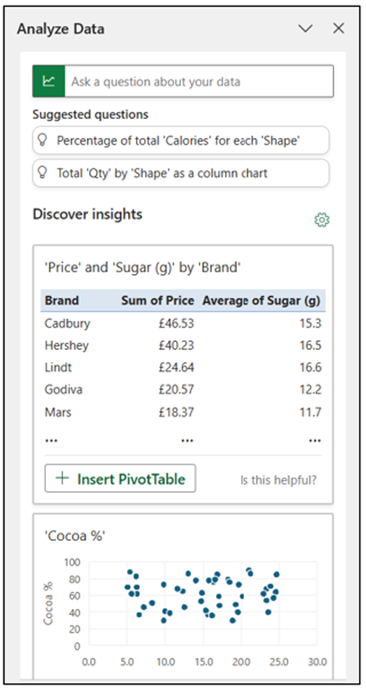
This provides ‘suggestions’ automatically, based on your current data. There is a scroll bar on the right to view multiple suggestions. You can review each of the suggestions for their usefulness, and each one has an option to insert that item, whether it’s a pivot table, chart, or table.
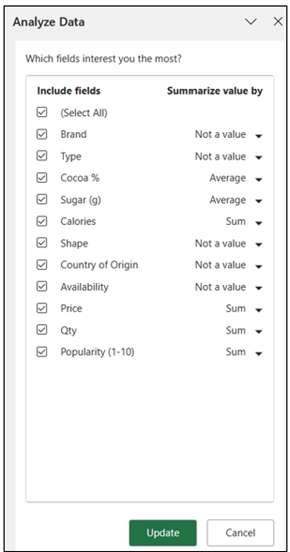
At the top of the panel (near ‘discover insights’), there is a little cog you can click to amend the setup options, as follows, in order to make the charts and tables more aligned to your needs:
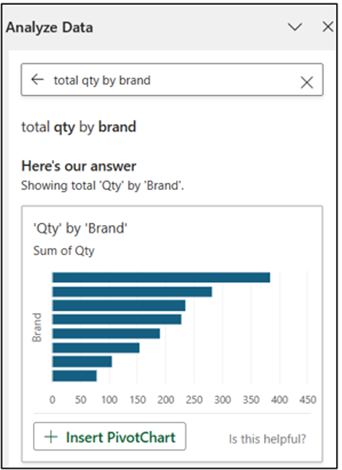
At the very top of this panel, you can see there’s an area where you can ask a question. Simply type your question (in plain English) into this bar:
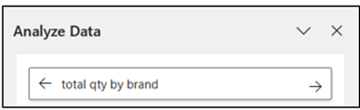
Here is the response:
Click ‘Insert Pivot Chart’ and this will be inserted into a new sheet within the file:
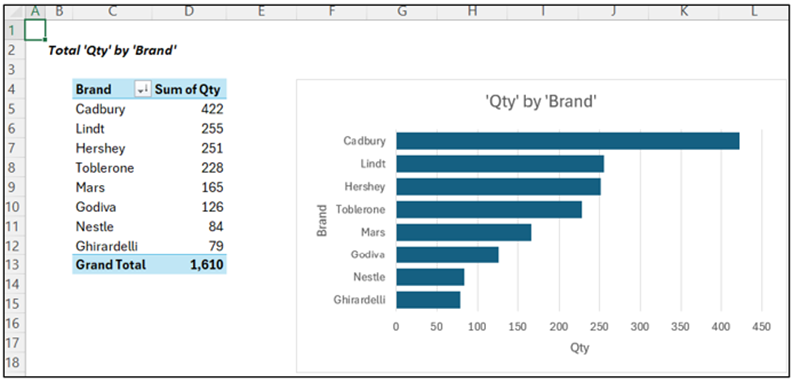
This new sheet now includes a Pivot Table and Chart, both connected to the raw data, which will update any time the data changes by right-clicking the table or chart and selecting ‘Refresh’.
This is brilliant, as it saves the user from needing to create these manually.
However, this method doesn’t provide any information about ‘refreshing data’ or extending the range, so it is not a ‘future-proof’ solution unless you already understand the tools used.
Analyze Data
✅ Pros
- Built directly into Excel – no setup required
- Free with Microsoft 365
- Instant charts, trends, and summary insights
- Great for quick descriptive analysis (e.g., ‘total sales by region’)
- Safe for corporate use
- Easy to use for beginners – click-based interface
❌ Cons
- Needs clean tabular data (e.g., no merged cells, blank headers)
- No support for custom calculations or logic
- Can be hit-and-miss – sometimes gives irrelevant suggestions
- Not available in all versions (must have Microsoft 365, not standalone Excel 2019)
- Doesn’t generate new formulas – only summarizes existing data
Practical Use: ChatGPT
ChatGPT can be used for general Excel questions. Simply type your question into this box and click the arrow to search:
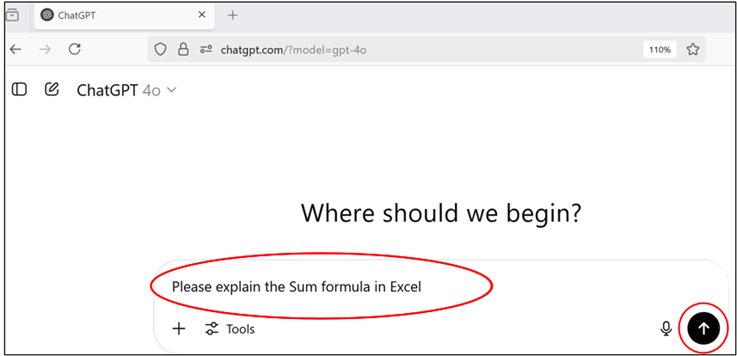
The response will be instant:
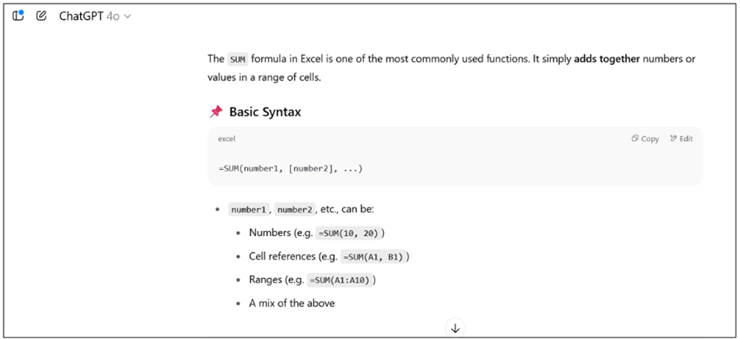
This is a fantastic tool if you want to better understand a specific formula or functionality.
You can also take it a step further to get a simpler explanation:
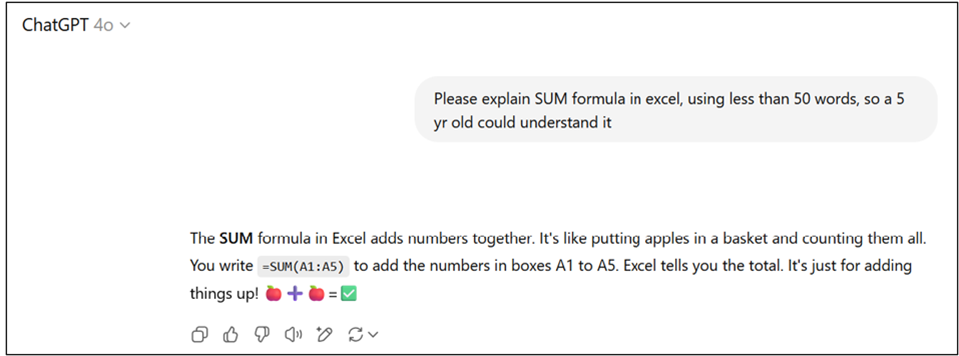
The more specific your question, the better the answer you will get.
As ChatGPT is a standalone tool, it has no access to or awareness of your data; therefore, in order to use it for specific data questions, you must describe your data within your questions.
So, to achieve the same summary as above with Data Analyze, the prompt would be:
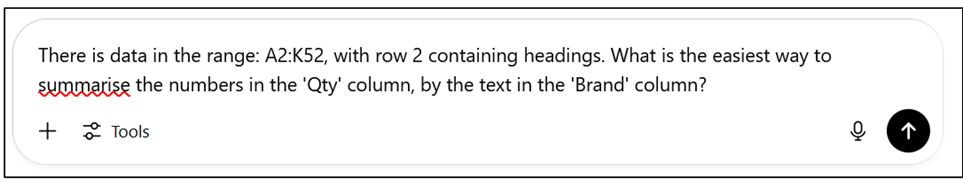
This is the response:
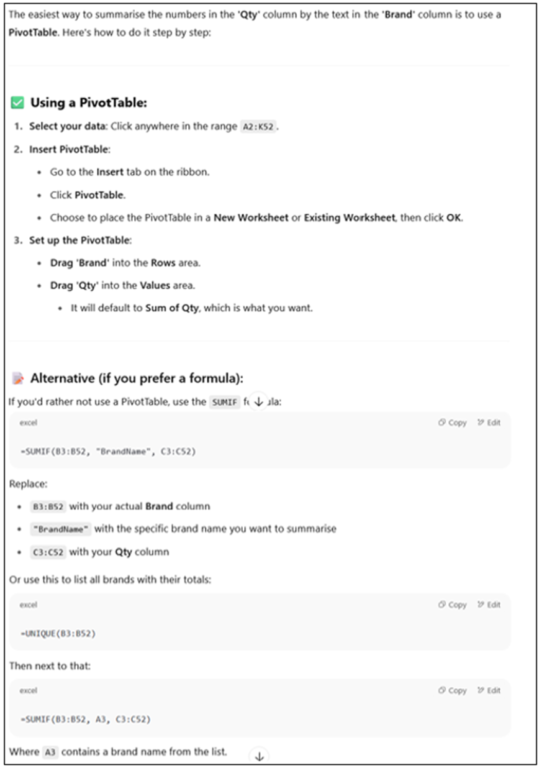
ChatGPT provides the instructions to create the Pivot Table manually. It also provides an alternative solution, describing how to use a SUMIF formula instead.
It’s also possible to copy formulas directly from the solution, but of course, the accuracy is dependent on the correct range being included in the initial question.
ChatGPT
✅ Pros
- Great for formulas, VBA, and Power Query
- Explains concepts in plain English
- Works outside Excel
- Very flexible – works even without actual data
- Helps debug errors or simplify formulas
- Useful for brainstorming dashboard ideas, templates, automation tips
❌ Cons
- Not embedded in Excel
- Doesn’t access your actual workbook
- Needs specific prompts – unclear input may lead to generic answers
- Can occasionally generate incorrect formulas or suggest non-existent functions
- Not aware of your spreadsheet’s structure unless you provide it
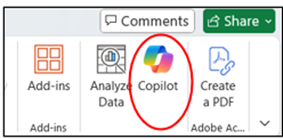
Practical Use: Copilot
This tool lives in the ‘Home’ ribbon (on the right):
This will open a panel that appears on the right-hand side of the screen:
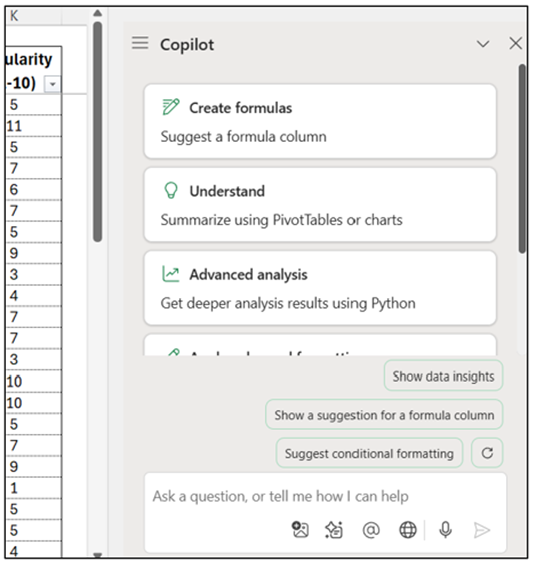
From here, you can ask questions about your data in plain English – no techy jargon needed!
This is the suggestion provided, from the ‘Create a formula’ option:
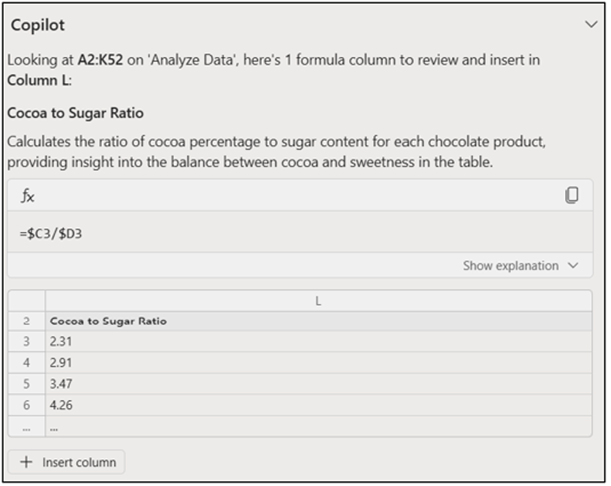
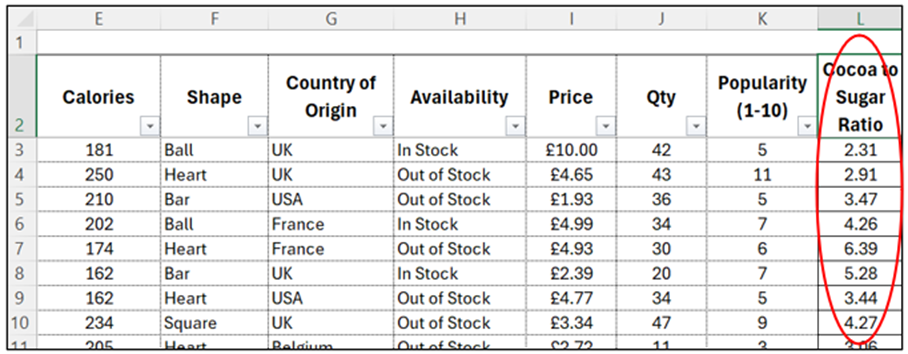
The suggested formula here is the ‘cocoa to sugar ratio’. It shows the formula to use (this also provides the copy function) and also provides a sample of what the result would look like. At the very bottom is the option to ‘Insert column’, which will literally insert that column into the LIVE data, like this:
There are also handy sections like Create formulas, Advanced analysis,and Show data insights – each designed to speed things up and make sense of your spreadsheet. It’s a bit like having an Excel trainer built right into your workbook!
My favourite function to use is Show data insights.
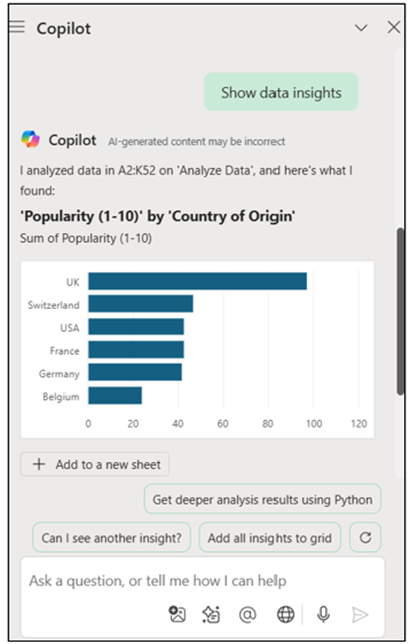
This has suggested a chart showing popularity by country of origin, with the option to ‘Add to a new sheet’ (underneath chart).
There are also options of ‘Can I see another insight’ and ‘Add all insights to grid’ – this is my personal favourite, as it creates a mini dashboard of all the insights, like this:
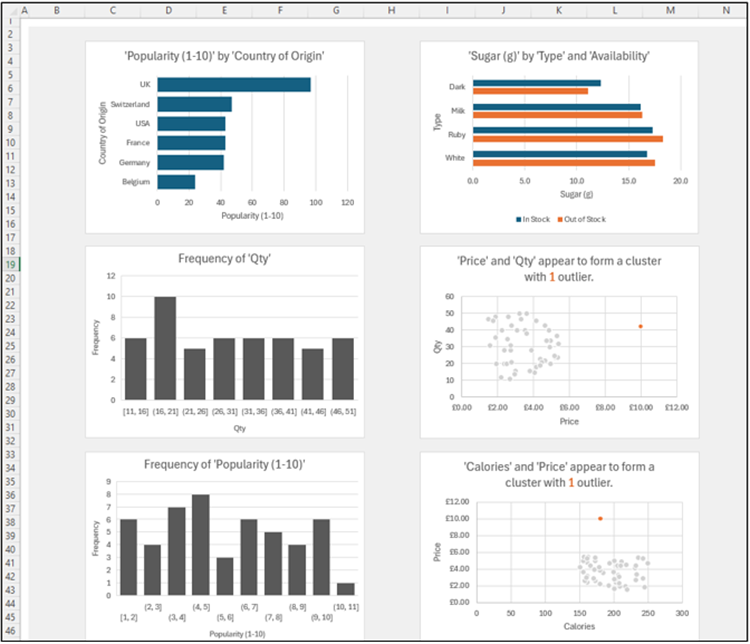
Of course, the usefulness and relevance of these charts is for you to decide, but it’s a great starting point that you can continually tweak and amend to match what you need. Quite often, one (or more) of these insights may well show something not considered before.
Copilot
✅ Pros
- Fully embedded in Excel
- Context-aware – understands your spreadsheet
- Writes formulas, creates PivotTables, and explains what data shows
- Understands natural language questions
- Can automate repetitive tasks
- Excellent for building dashboards and summaries
❌ Cons
- Requires Microsoft 365 Copilot licence – expensive (additional per-user/per-month cost)
- Only available for Enterprise/Business accounts (as of 2025)
- Needs well-structured data to perform best
- Sometimes gives incorrect results or over-simplifies
- Requires internet connection and Microsoft’s cloud AI and Autosave to be switched on
- Sometimes stalls or gives the vague “I can’t do that right now”
Pitfalls to Avoid
While AI tools for Excel are incredibly powerful, they’re not perfect. Here are some key pitfalls to watch out for when using ChatGPT, Analyze Data, or Copilot – and how to avoid them:
- Blind Trust – AI can be wrong. Always check logic and results.
- Privacy Risks – Never paste confidential data into ChatGPT.
- Over-Reliance – AI assists, but doesn’t replace human judgement.
- Misunderstanding Tool Limits – Know which tool is best for your task.
- Generic Output – Be specific in your questions to get tailored answers.
AI can accelerate your work dramatically, but don’t turn off your inner quality checker. Think of it like driving with cruise control: it helps, but your hands should still be on the wheel.
Conclusion
Each AI tool offers something unique, and you don’t have to pick just one. In fact, they complement each other beautifully:
- Use ChatGPT when you’re stuck, learning, or need custom formulas or clear explanations. It’s like having a personal tutor who never gets tired.
- Use Analyze Data when you want fast, no-fuss summaries of large tables – especially for non-technical users.
- Use Copilot when you want to get things done quickly – whether that’s building a report, analysing trends, or answering a stakeholder’s “Can you just…” question in seconds.
These tools are here to help – but the most powerful asset is still YOU.