Mike Thomas explains how to use the data model to work around some of Excel’s pivot table limitations
Pivot tables are used to summarise a set of data. Traditionally, a pivot table’s “source data” is a tabular range stored in the worksheet cells. However, there is another place inside an Excel file that can store tabular data. That place is the workbook’s data model.
The Data Model
If the pivot table’s source data is stored in the worksheet cells, you’ll be able to view and edit it. However, if the data is stored in the data model, by default, you won’t see it. The data model isn’t part of the worksheet grid. The data model is hidden away behind the scenes.
To view the data model, click the green Manage Data Model button located towards the right-hand side of the Data tab on the Ribbon.

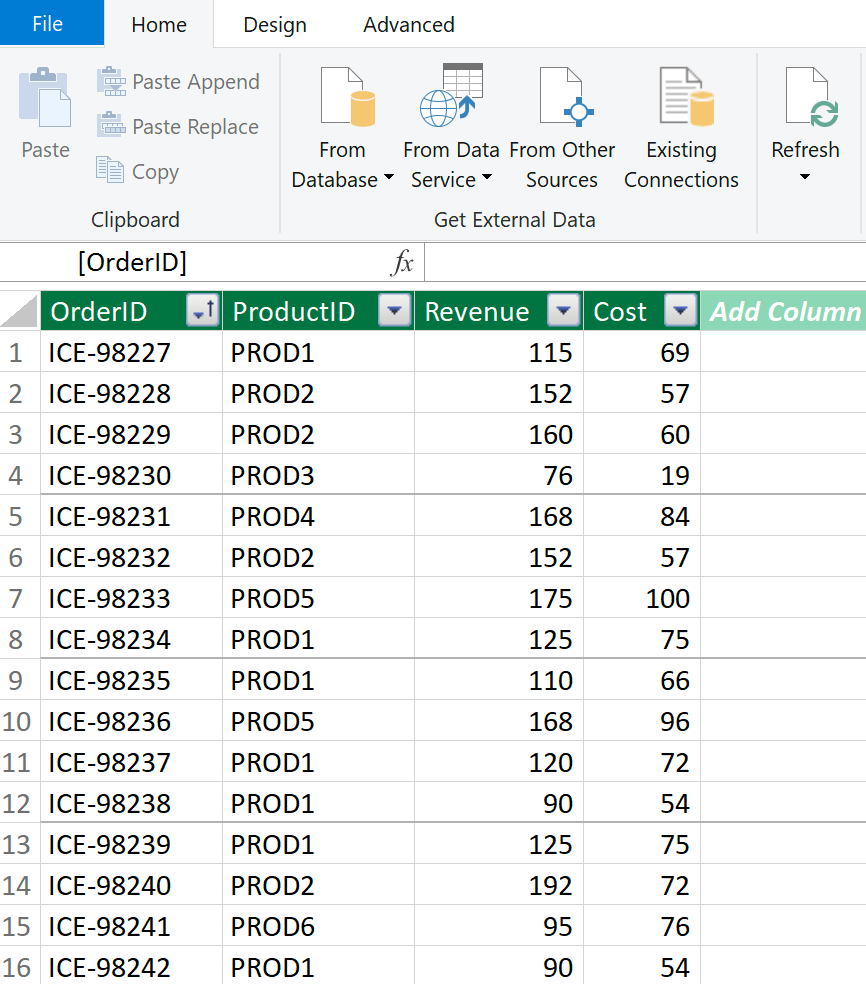
A new window is opened, revealing the contents of the data model. Although tables stored in the data model have row numbers, there is no concept of column letters or cells.

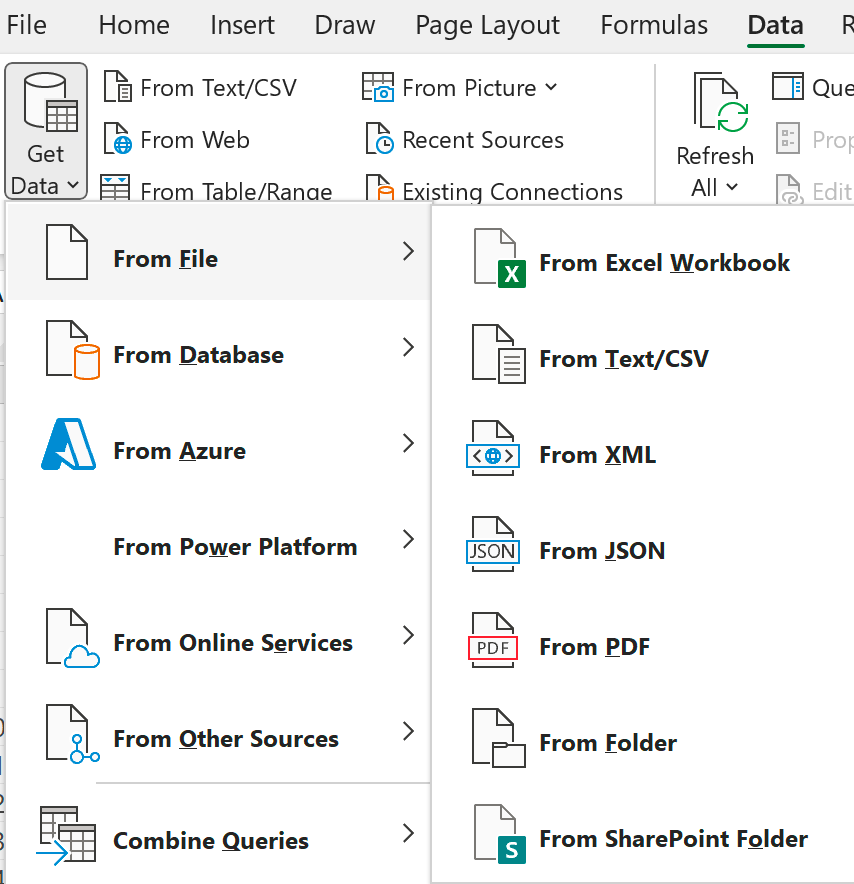
Every Excel file has its own data model, and initially, like a new workbook, it is empty. You can’t enter data directly into the data model, but you can use Data > Get Data (also known as Power Query) to upload data into it, either from a range of cells in the current workbook or from an external data source such as another Excel file, a CSV file, a PDF file, a SharePoint List or even a web page!

You can’t directly edit the data in the data model either. If the original data changes, back in Excel, click Data > Refresh All and the data in the data model is magically updated.

Why store your data in the data model? Why not continue to work “old school” and store the data in the worksheet cells?
Benefits of the Data Model
1. Capacity of the data model versus the worksheet
An Excel worksheet contains 1,048,576 rows, whereas the data model can hold up to 2 billion tables with each table able to store just under 2 billion rows!
Although that is more than enough for most users, you never know when you might need to work with huge datasets. A client recently told me about a problem they were having importing a CSV file containing 1.5 million rows into an Excel worksheet. I explained to them that because there’s not enough rows in the worksheet, they’d have to load the data into the data model instead.
Even if your datasets are relatively small, it’s well-known that Excel can suffer poor performance (unresponsive, slow to recalculate, delayed scrolling) when working with large worksheet-based datasets (large being anywhere from 50,000 rows of data in some instances).
2. Create pivot tables from multiple lists or sources
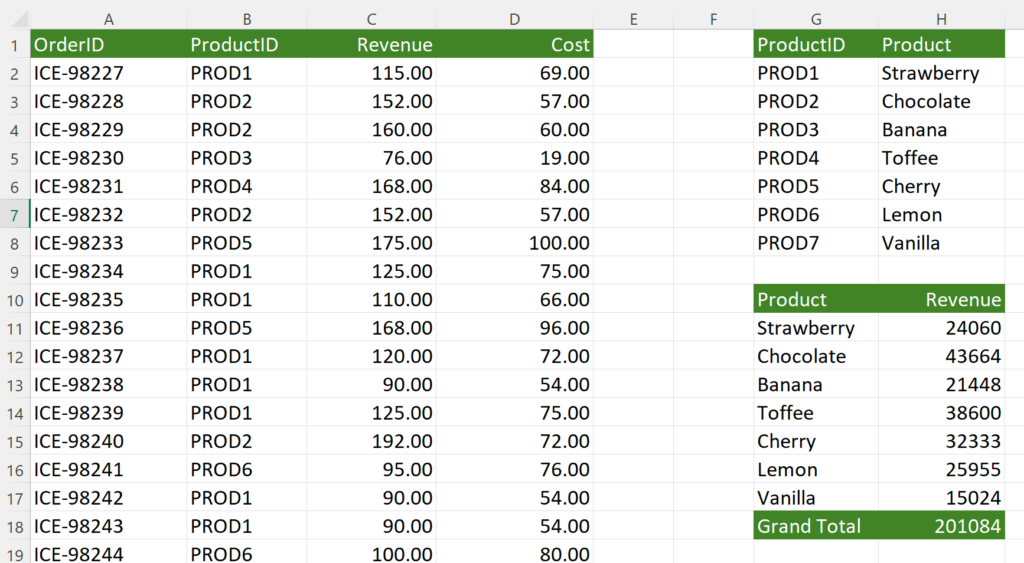
This is the primary reason for storing data in the data model. In the screenshot below there are two tables (A1:D19 and G1:H8). One contains information about orders, the other contains information about products. The tables can be connected using the values in the ProductID columns.

To create the pivot table in G10:H18, the data must be stored in the data model because Excel will not allow you to create a pivot table from multiple worksheet-based tables.
And don’t forget that the data in the data model can originate from more than one location, making this a very powerful tool for combining and analysing data from multiple sources.
3. The power of DAX
DAX is the name of a formula language that is built into Excel and is primarily used to create measures which are formulas that summarise data that is stored in the data model.
The values generated by measures are used in pivot tables and charts and can even be used within worksheet formulas.
The good news for anyone wanting to learn the basics of DAX is that many of the functions are identical to or similar to Excel’s worksheet functions (SUM, AVERAGE, COUNT, IF, etc.).
So, whilst you’d enter =SUM(A1:A20) into a cell to add up the numbers in A1:A20, to add up the numbers in the Revenue column in a table in the data model, you’d create a DAX formula =SUM([Revenue]).
The screenshot below shows data stored in the data model in a table called Orders.

If this data was stored in A1:D16 in a worksheet and you needed to know how many orders there were for PROD1, you’d enter =COUNTIF(B1:B16,”PROD1″) into a cell.
The equivalent DAX formula is:
=CALCULATE(COUNTROWS(Orders), Orders[ProductID]=”PROD1″)
Don’t be fooled though. DAX is way more powerful than worksheet formulas and functions. Think of DAX as Excel formulas on steroids!
DAX contains functions that you won’t find in the worksheet side of Excel, many of which relate to date and time calculations. DAX also supports the creation and use of variables as well as a wider range of data types, making it a more powerful method of creating formulas.
The Data Model – The Way Forward?
Even if your requirements are simple, storing the data in the data model future-proofs your workbooks. Here’s a typical scenario:
You have a small table in a worksheet and build a few pivot tables based on that data. Six months later you add a second, related table to the worksheet which needs to be included in the pivot table, and you also need to perform some fairly complex calculations that are outside the scope of Excel’s standard functions.
You would have no choice but to add the two tables to the data model. Then, for consistency, so all your pivot tables (existing and future) are based on the same data source, you’d need to recreate the existing pivot tables. More work than you needed to do.
Use the data model to store your data regardless. It’s the way forward. It’s what Microsoft recommend too.


